Comparing AI, Machine Learning, Deep Learning, and Statistical Time Series Models: Optimizing Forecasts with RoadMap TrailBlazer
Comparing AI, Machine Learning, Deep Learning, and Statistical Time Series Models: Optimizing Forecasts with RoadMap TrailBlazer
In today’s data-driven world, the ability to accurately predict future trends is more critical than ever. Time series forecasting empowers businesses and researchers to make informed decisions by analyzing historical data to anticipate future results. Whether it’s forecasting stock prices, weather patterns, product demand, or financial trends, precise predictions can provide a significant strategic advantage.
However, with the vast array of forecasting models available—from traditional statistical methods to advanced machine learning and deep learning algorithms—choosing the right model for your specific dataset can seem overwhelming. Each model has its strengths and is suited for particular types of data and forecasting objectives. How do you navigate this complex landscape to find the optimal model for your needs?
This is where RoadMap TrailBlazer comes to the rescue. RoadMap TrailBlazer is an all-in-one platform designed to simplify the time series forecasting process.
TrailBlazer supports rigorous model evaluation through cross-validation, allowing you to compare over 45 different forecasting models. It provides key evaluation metrics such as Mean Absolute Error (MAE), Mean Absolute Percentage Error (MAPE), and Root Mean Squared Error (RMSE) to help you select the best model for your specific application.
In this article, we’ll explore how to leverage RoadMap TrailBlazer for efficient model comparison and optimization. We’ll dive into the various categories of forecasting models, understand the importance of evaluation metrics, and walk through a real-world case study using eight years of monthly sales data.
Understanding Time Series Forecasting Models
Time series forecasting involves analyzing sequential data points collected over time to predict future values. The choice of model can significantly influence the accuracy and reliability of your forecasts. Understanding the different types of models and their characteristics is crucial for effective forecasting.
Categories of Forecasting Models
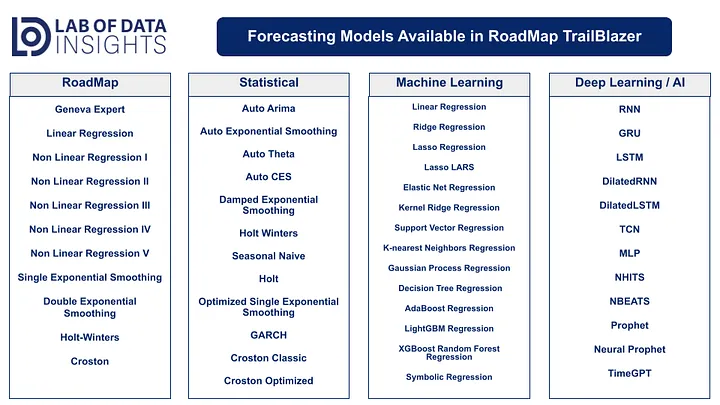
RoadMap TrailBlazer offers a diverse array of forecasting models, categorized into:
- RoadMap Technologies Models: Developed specifically for demand forecasting applications, these models combine efficient parameter search, outlier detection algorithms, and rule-based systems for automatic best-fit forecasts.
- Statistical Models: Provide interpretable results with trend and seasonality without heavy computational resources. These models are optimized for high performance and scalability. Examples include Auto ARIMA and Holt-Winters.
- Machine Learning Models: Great for detecting complex patterns and interactions, with feature engineering and optional data transformation to handle non-linear relationships. Models like Random Forest Regression and XGBoost fall into this category.
- Deep Learning Models: Pre-trained neural networks focused on usability and robustness, capable of capturing intricate patterns in sequential data. This includes models such as LSTM and NBEATS.
- Generative AI Model: Advanced models like TimeGPT leverage state-of-the-art neural network architectures for superior forecasting.
Understanding these categories helps you identify which models might be best suited for your data and forecasting goals.
Why So Many Models?
There is no one-size-fits-all model for time series forecasting. Different models excel with different datasets due to variations in data characteristics such as trends, seasonality, noise, and outliers. Having a diverse set of models allows you to find the best fit for your specific data and objectives.
Key Performance Metrics for Model Evaluation
Selecting the right model goes hand-in-hand with proper evaluation. Evaluation metrics help quantify how well a model’s predictions match the actual observed values. RoadMap TrailBlazer provides several key metrics:
-
Mean Absolute Error (MAE): The average of the absolute differences between predicted and actual values. It provides a straightforward measure of prediction accuracy in the same units as the data.
Recommendation: When all errors are equally important. -
Mean Absolute Percentage Error (MAPE): The average of the absolute percentage differences between predicted and actual values. This metric expresses errors as a percentage, making it easy to understand relative to the actual values.
Recommendation: When you need to interpret errors in percentage terms. -
Root Mean Squared Error (RMSE): The square root of the average squared differences between predicted and actual values. RMSE penalizes larger errors more than smaller ones, making it useful when large errors are particularly undesirable.
Recommendation: When you want to heavily penalize large errors.
Understanding these metrics helps you make an informed decision when choosing the best model for your forecasting objectives.
Introducing RoadMap TrailBlazer
Before diving into the practical steps, let’s briefly introduce RoadMap TrailBlazer and understand how it addresses challenges in model selection and forecasting.
What is RoadMap TrailBlazer?
RoadMap TrailBlazer is an all-in-one platform for time series forecasting that allows users to:
- Compare over 45 different forecasting models: Access a wide range of models across various categories to find the best fit.
- Automate model selection: Quickly identify the optimal model within each category based on chosen evaluation metrics without manually testing each one.
- Transform and prepare data: Use built-in tools for data cleaning, preprocessing, and transformation.
- Visualize forecasts and historical data: Gain insights through interactive charts and graphs.
- Adjust forecasts: Utilize features like goal seeking and percentage adjustments to fine-tune predictions.
- Leverage AI assistance: Get model suggestions and analysis from integrated AI tools.
How Does TrailBlazer Simplify Forecasting?
- User-Friendly Interface: No coding required; users can interact through a spreadsheet-like interface that is intuitive and easy to navigate.
- Automated Model Selection: Saves time by automatically running multiple models and selecting the best-performing one based on your criteria.
- Data Transformation Tools: Allows you to handle data preprocessing tasks within the platform, eliminating the need for external tools.
- Real-Time Visualization: Provides immediate feedback on model performance, helping you quickly assess and compare results.
- AI Integration: Offers intelligent recommendations and insights to enhance your forecasting process.
By integrating these features, TrailBlazer streamlines the forecasting process, making it accessible even for those without extensive experience in data science or programming.
RoadMap TrailBlazer: Getting Started
RoadMap TrailBlazer is an all-in-one platform that streamlines the time series forecasting workflow. It integrates data preparation, model selection, forecasting, and evaluation into a single, user-friendly interface. This section provides a step-by-step guide to using TrailBlazer for model comparison and optimization.
Step 1: Preparing Your Dataset
Data Requirements
- Frequency: Monthly or weekly time series data.
- Format: Date and corresponding value(s), preferably in a spreadsheet format for easy manipulation.
- Quality: Ensure data is clean, with no missing values or suspicious outliers that could skew results.
For testing purposes, users can find datasets of monthly frequency from publicly available data repositories such as Kaggle or from FRED.
TrailBlazer also provides a sample dataset of average monthly temperatures for five major U.S. cities to help you get started.
Generate a Data Template
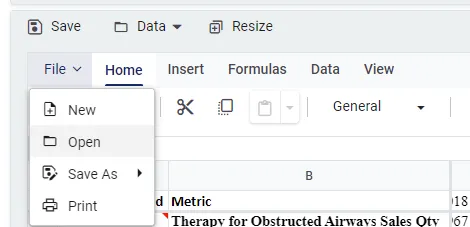
After logging into TrailBlazer, you can generate a formatted data template within the app:
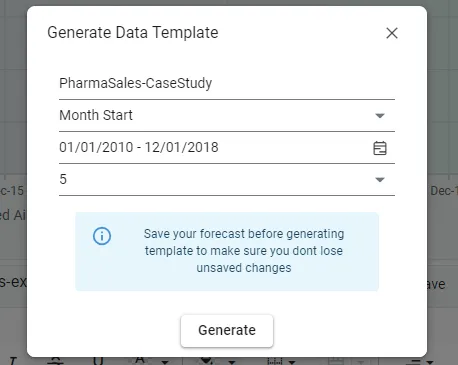
- Generate Template: Use the “Generate Data Template” option to create a template that matches TrailBlazer’s data format.
- Export to Excel: Optionally, export the template to Excel, where date fields and metric columns are prefilled.
- Fill in Data: Enter your time series values corresponding to the metrics and dates you wish to forecast.
Step 2: Data Entry
Option 1: Import from Excel/CSV
- Prepare Your Dataset: Format your data in Excel or CSV to match the template.
- Import Data: Use the Import Data function to upload your file.
Option 2: Copy and Paste
- Copy Data: Copy data directly from your spreadsheet.
- Paste Data: Paste it into the TrailBlazer spreadsheet component.
Step 3: Prepping Data for Forecasting
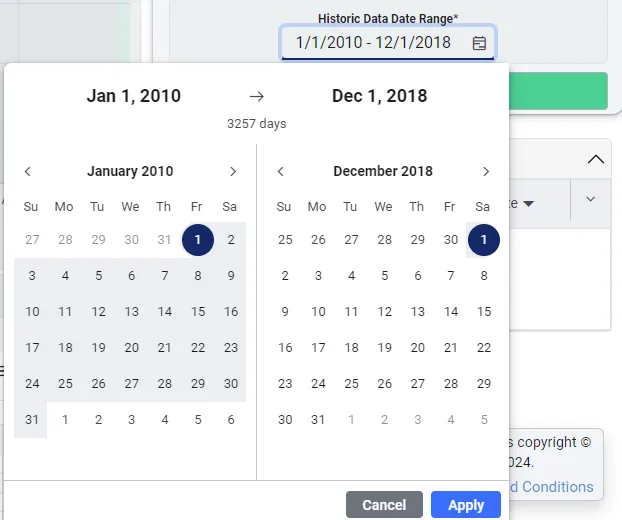
Setting the Historic Data Date Range
- Define Date Range: Specify the subset of historical data to be used for forecasting by setting the start and end dates.
- Focus on Relevant Data: Concentrate on the most pertinent period and exclude outdated or irrelevant data.
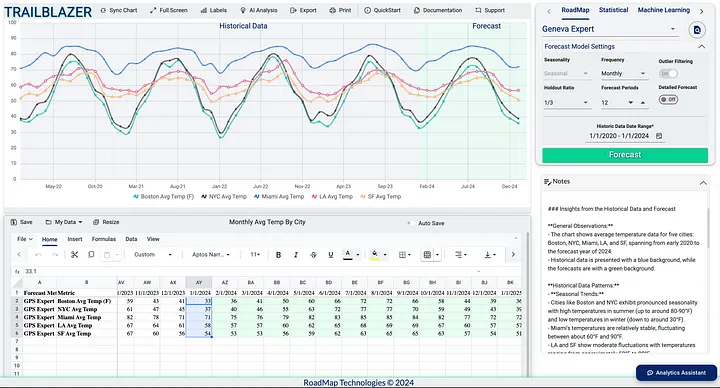
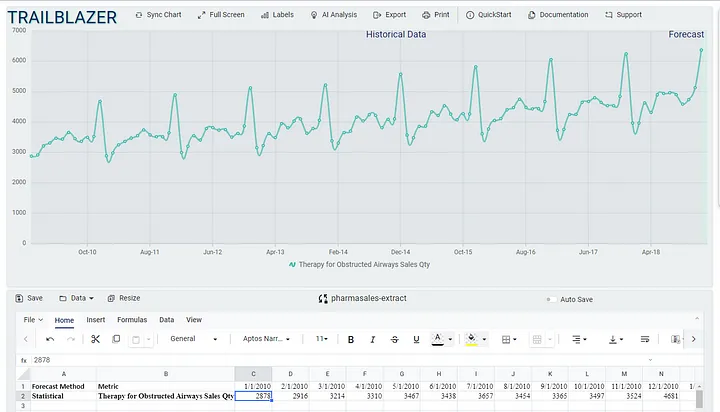
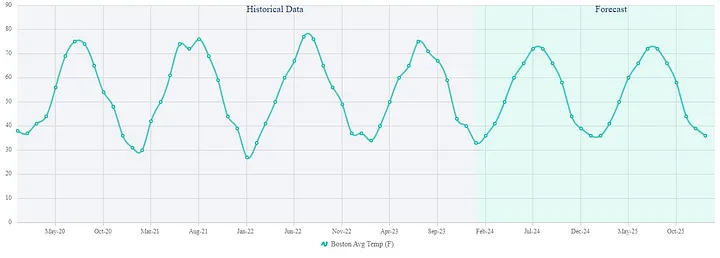
Visualize Historical Data
- Use Built-in Chart: Navigate to the chart component within TrailBlazer.
- Identify Patterns: Examine the data for trends, seasonality, and patterns.
- Detect Abnormal Data: Spot any anomalies or inconsistencies that may need addressing before forecasting.
- Confirm Historical Data: Ensure the historical data appears with a blueish gray background in the chart, while forecasted data will appear with a light green background.
Saving Your Data
It’s important to save your dataset to prevent data loss and for future reference.
- Manual Save: Click the “Save” button to store your dataset within TrailBlazer.
- Auto Save: Enable the “Auto Save” feature to automatically save changes as you work.
Benefits:
- Ensures your data is backed up.
- Allows for easy retrieval and reuse in future forecasting tasks.
- Serves as a repository for all your forecasts in one place.
Step 4: Setting the Evaluation Metric
When using the “ALL” option, you can choose your preferred evaluation metric:
- Choose Metric: Select between MAE, MAPE, or RMSE.
- Purpose: The selected metric will be used to compare model performance and select the optimal model within the forecasting category.
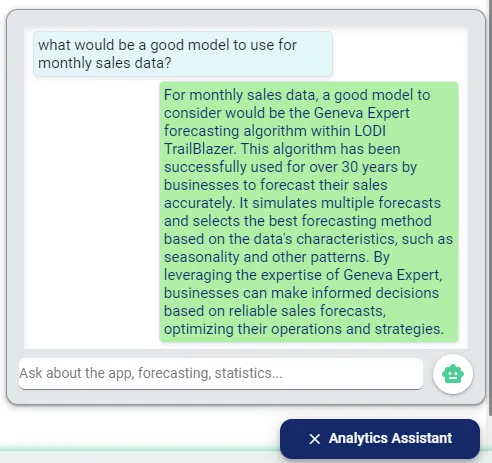
AI Assistance for Model Selection
If you’re not sure which model to use, TrailBlazer’s AI Analytics Assistant can help:
- Access AI Assistant: Click on the “Analytics Assistant” button in the bottom right corner.
- Ask for Recommendations: Chat with the assistant and provide information about your data characteristics.
- Receive Suggestions: The AI Assistant will recommend suitable models based on your input.
Step 5: Running the Models
Data Selection
Before running forecasts, you need to select the data to be forecasted:
- Select Data: Highlight the rows or cells in the spreadsheet containing the data you wish to forecast.
- Minimum Selection: At least one cell in the row you wish to forecast.
- Multiple Rows: You can select multiple rows to forecast simultaneously.
- Important: Do not select the historic dates row; that row cannot be forecasted.
Initiate Forecast
- Click “Forecast”: After selecting your data and models, click the “Forecast” button to begin the forecasting process.
Real-Time Processing
- Monitor Progress: Use the Processing Indicator in the Forecasting Panel to track the status of your forecasts.
- Notifications: TrailBlazer will notify you once all forecasts have been successfully run. If any errors occur during forecasting, you will receive an alert with details.
Note: TrailBlazer efficiently handles the computational workload, allowing you to focus on interpreting the results.
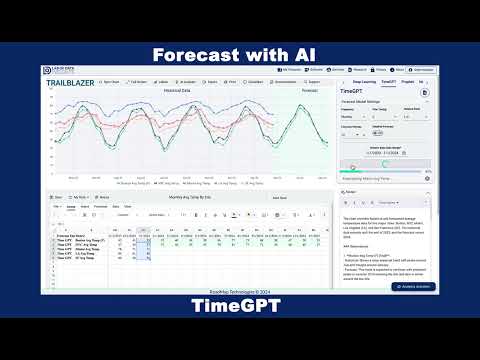
Here is a quick video showing all types of forecasting being used within TrailBlazer:
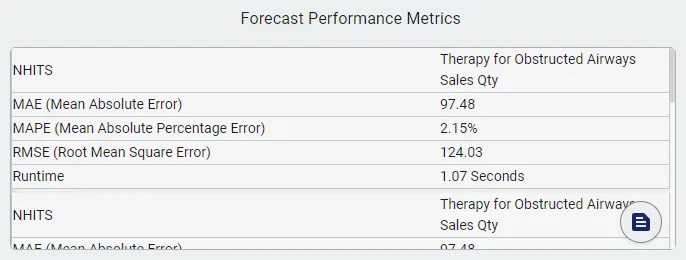
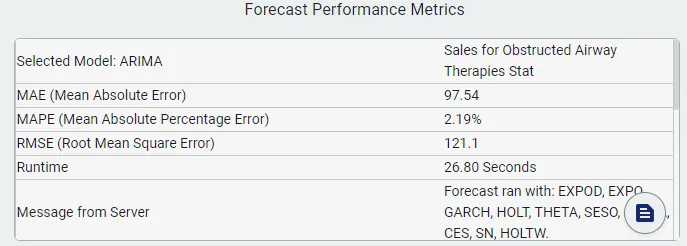
Step 6: Obtaining Performance Metrics
Accessing Results
- Forecast Performance Log: View detailed logs for each model run. Metrics include MAE, MAPE, RMSE, and runtime.
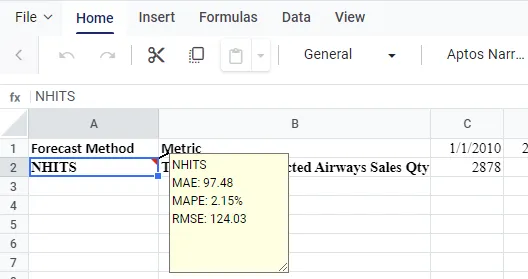
Spreadsheet Annotations
- Automatic Annotations: Metrics are automatically appended to the forecasted data within the spreadsheet.
- Easy Reference: This allows you to quickly compare model performance directly within your dataset.
Step 7: Analyzing Results
With the performance metrics at hand, you can analyze and compare the models:
Tips for Interpreting Results
- Multiple Metrics Matter: Use a combination of MAE, MAPE, and RMSE for a comprehensive evaluation.
- Balance Complexity and Performance: A more complex model isn’t always better if the performance gain is marginal. Consider the trade-off between model accuracy and computational efficiency.
- Business Context: Think about how the model will be used in practice. Factors like interpretability and ease of implementation may influence your choice.
- Review Forecast Settings: If the forecast seems inaccurate, verify that the model settings align with the historical data context. Adjust parameters if necessary to improve accuracy.
Visualize the Data
- Real-Time Visualization: Use TrailBlazer’s visualization tools to see how well the forecast captures seasonality, trends, and outliers.
- Compare Models: Overlay multiple forecasts to visually compare their performance. (Example in Case Study Below)
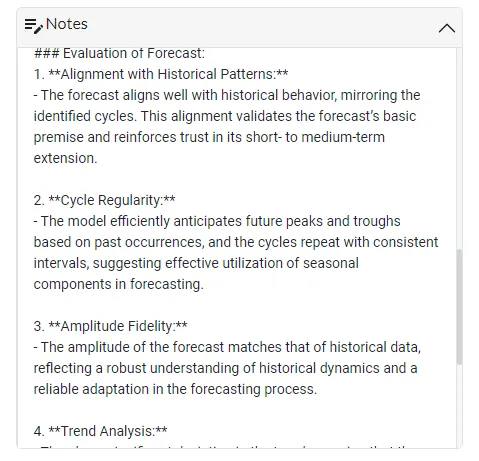
AI Evaluation of Forecasts
Use TrailBlazer’s AI Analysis to have the system evaluate your forecasts within the chart component. Users can provide additional context about their chart, such as surrounding business factors, for more accurate and actionable insights.
Generate Insights:
The AI will analyze the forecasted data and provide insights, which are appended to your notes.
Benefits:
- Gain a deeper understanding of forecast performance.
- Identify potential areas for improvement.
Step 8: Adjusting Results (Optional)
Sometimes, external factors not accounted for in the model may influence future outcomes. TrailBlazer provides tools to adjust forecasts accordingly.
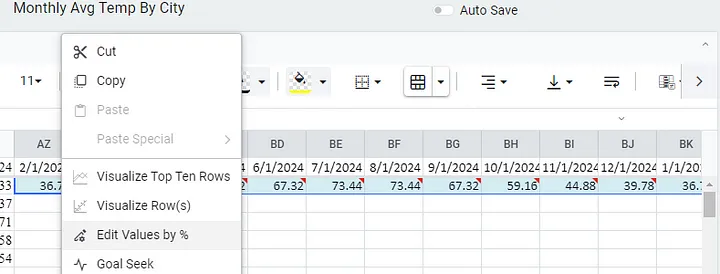
Edit Values by %
Adjust Forecasts:
Modify forecasted values by a specific percentage to incorporate external assumptions.
Example: If you anticipate that average temperatures will increase by 2% due to global warming, you can adjust the forecasted temperatures accordingly.
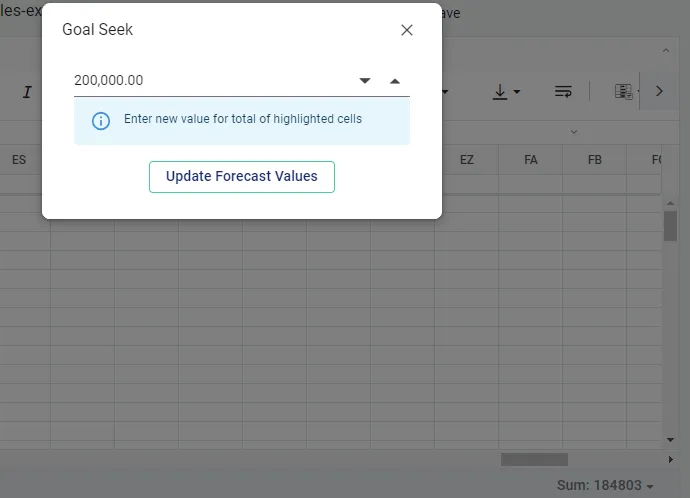
Goal Seeking
Set Targets:
If you have specific goals (e.g., sales targets), use the Goal Seeking feature to adjust forecasts.
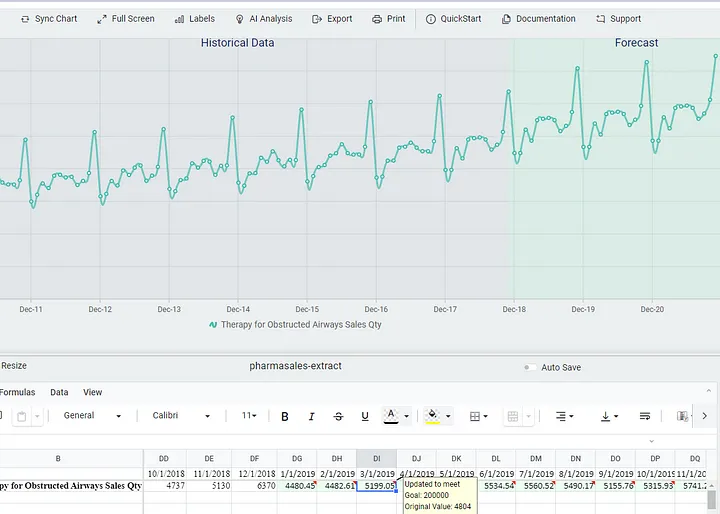
Maintain Trends:
TrailBlazer adjusts the forecasted values to meet your projected goal while preserving seasonal trends and patterns.
Process:
- Input the desired goal into the Goal Seeking tool.
- The system recalculates the forecasts to align with your target.
Case Study: Selecting the Optimal Forecasting Model for Monthly Sales of Obstructive Airway Therapies
To illustrate the application of the steps outlined above, we’ll conduct a detailed case study using a real-world dataset.
Scenario
A pharmaceutical company seeks to forecast the next three years of monthly sales for therapies used to treat obstructive airways. Accurate forecasts are crucial for optimizing inventory levels, planning production, and strategizing marketing efforts. Historical sales data spanning eight years is available for analysis.
Step 1: Download the Data
We begin by obtaining a publicly available dataset for sales of Therapies for Obstructed Airways from Kaggle.
Step 2: Data Preparation
ETL: Extract, Load, and Transform the Data
-
Download: Bring the data (.csv or .xlsx) into Excel or Google Sheets.
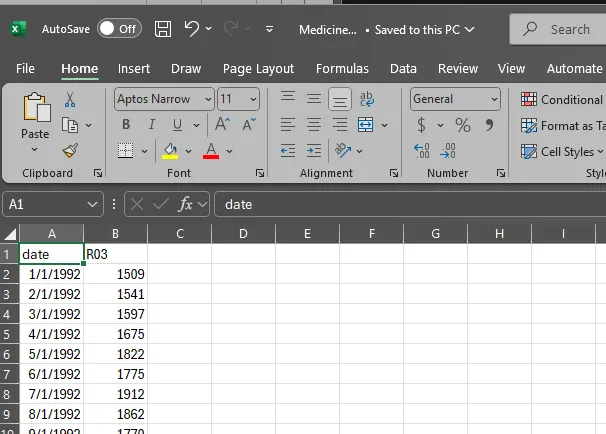
- Clean: Exclude data prior to 2010 and focus on the eight most recent years of data.
-
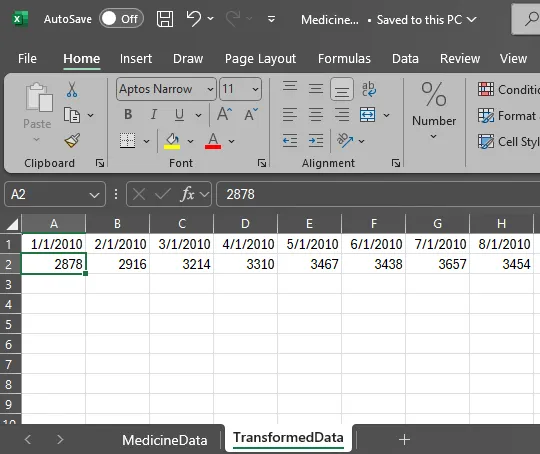
Transform: Convert the data into a longitudinal format with two columns: Date and Sales. This format is compatible with TrailBlazer’s requirements.
(Users can also just copy sales values, and generate the dates in TrailBlazer.)
- Generate a Data Template and set the parameters to match the dataset.
-
Import: Copy and paste the transformed data from your spreadsheet into the TrailBlazer spreadsheet component.
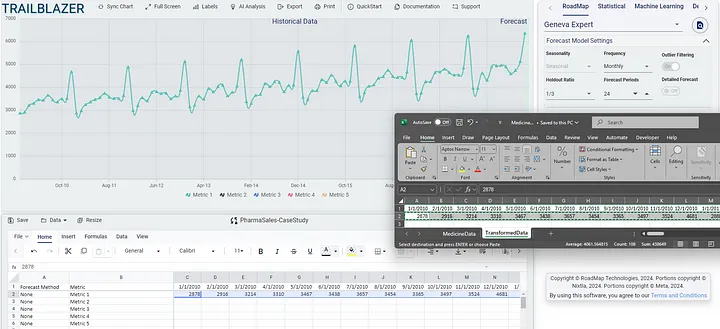
- Label the Metrics: Rename “Metric 1” to “Monthly Sales of Obstructive Airway Therapies” for clarity.
-
Save the Data: Click the “Save” button.
The Last Saved timestamp at the bottom of the spreadsheet component tracks when the dataset was last saved.
Step 3: Preparing the Data for Forecasting
To compare different forecasting methods side by side, we’ll create copies of the historical data within TrailBlazer:
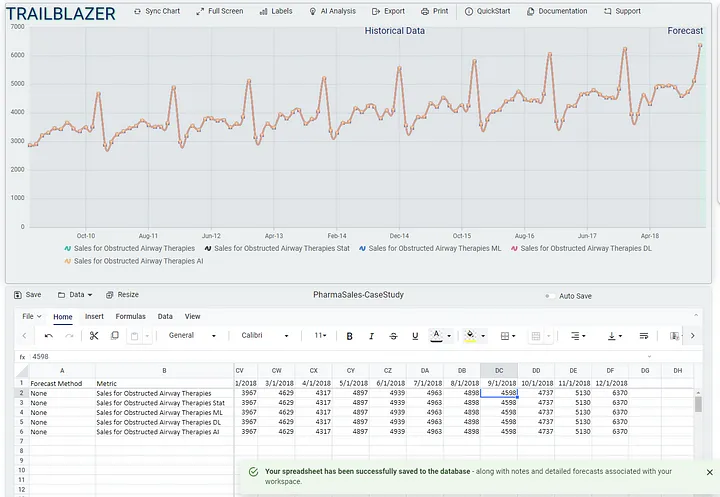
- Create Data Copies: Duplicate the historical data time series into five separate rows.
-
Label Each Row:
- Row 1: RoadMap Technologies Models
- Row 2: Statistical Models
- Row 3: Machine Learning Models
- Row 4: Deep Learning Models
- Row 5: Generative AI Model (TimeGPT)
Purpose: This setup allows us to apply different forecasting methods to the same dataset and directly compare their performance.
Step 4: Forecasting with Automated Model Selection
We’ll use TrailBlazer’s automated model selection feature to identify the best-performing model in each category. We’ll use RMSE as the evaluation metric for consistency.
Forecasting Steps:
-
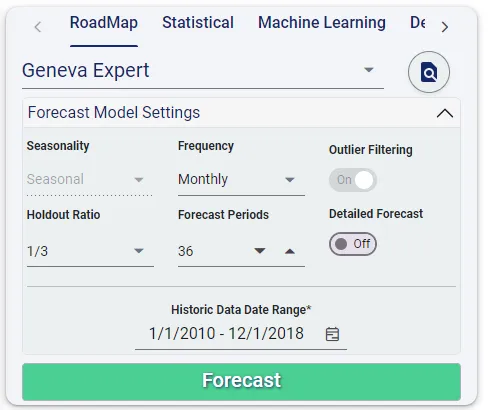
Row 1: RoadMap Technologies Models
- Model Selection: Use the Geneva Expert method, which automatically selects the best-performing RoadMap model.
-
Action: Select the row, customize settings if necessary, and click “Forecast”.
-
Row 2: Statistical Models
- Model Selection: Choose the “ALL” option to run all statistical models.
-
Action: Select the row, set RMSE as the evaluation metric, and click “Forecast”.
-
Row 3: Machine Learning Models
- Model Selection: Select the “ALL” option to run all machine learning models.
- Action: Select the row and click “Forecast”.
-
Row 4: Deep Learning Models
- Model Selection: Choose the “ALL” option to run all deep learning models.
- Action: Select the row and click “Forecast”.
-
Row 5: Generative AI Model (TimeGPT)
- Model Selection: Select TimeGPT.
- Action: Select the row and click “Forecast”.
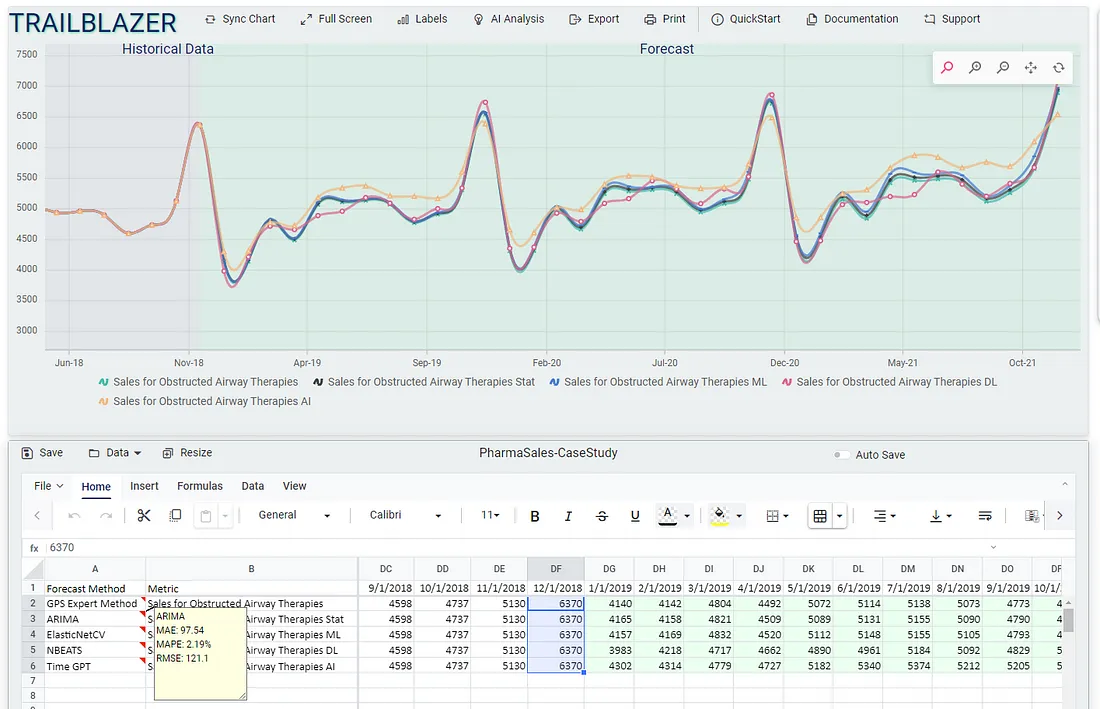
Step 5: Visualizing Results
After the forecasts are completed:
- Real-Time Visualization: TrailBlazer automatically displays each forecast on the chart alongside the historical data.
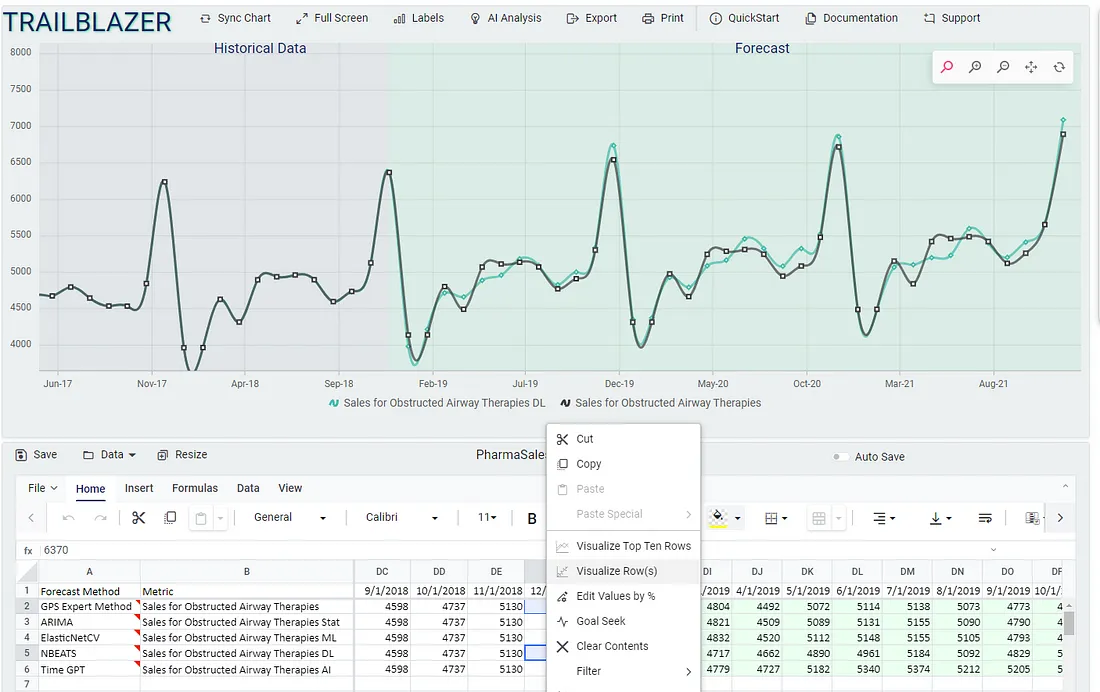
-
Interactive Analysis:
-
Zoom and Pan: Examine specific time periods in detail.
-
Compare Forecasts: Select multiple rows to visualize and compare different models.
-
Zoom and Pan: Examine specific time periods in detail.
Step 6: Comparing Metrics
After execution, by reviewing the Forecasting Metrics Log or the Forecast Method notes in the spreadsheet, we compile the list of evaluation metrics to compare.
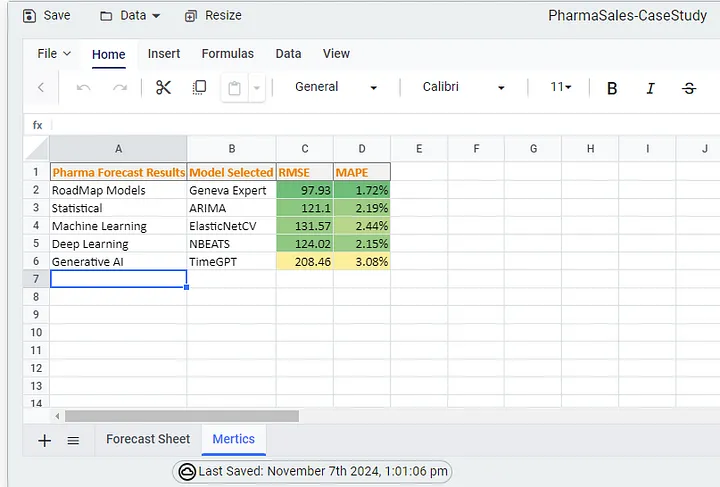
Step 7: Analysis and Conclusion
RoadMap Technologies Models (Geneva Expert)
- Performance: Achieved the lowest RMSE and MAPE.
-
Strengths:
- High Accuracy: Indicates robustness and precise fitting to the data.
- Domain-Specific Tuning: Leverages industry-specific insights to capture trends effectively.
- Practical Application: Ideal for immediate use due to its superior performance.
Statistical Models (ARIMA)
- Performance: Strong, with slightly higher error rates than Geneva Expert.
-
Strengths:
- Seasonality and Trend Handling: Excels in datasets with clear seasonal patterns.
- Interpretability: Provides valuable insights into underlying components.
- Transparency: Preferred when understanding the model mechanics is important.
Machine Learning Models (ElasticNetCV)
- Performance: Reasonable accuracy but outperformed by Geneva Expert and ARIMA.
-
Strengths:
- Regularization: Combines Lasso and Ridge to handle multicollinearity.
- Flexibility: Captures complex relationships without explicit trend assumptions.
- Overfitting Prevention: Robust choice for data with complex patterns.
Deep Learning Models (NBEATS)
- Performance: Competitive, with MAPE slightly above ARIMA.
-
Strengths:
- Nonlinear Pattern Detection: Excels at capturing intricate temporal dynamics.
- Future-Ready: Demonstrates how deep learning enhances forecasting accuracy.
- Complex Interactions: Captures subtle data interactions that simpler models may miss.
Generative AI Model (TimeGPT)
- Performance: Higher RMSE and MAPE in this case.
-
Strengths:
- Adaptability: Designed to adjust across diverse data patterns.
- Frontier Technology: Represents cutting-edge advancements in forecasting.
- Potential: With optimization, may become powerful for dynamic applications.
Summary and Winner:
- Winner: Geneva Expert (RoadMap Technologies Models)
- Why: Lowest error metrics, high robustness, and domain-specific tuning make it the optimal choice for this dataset.
Honorable Mentions:
- ARIMA: Reliable performance and valuable interpretability.
- NBEATS: Strong capability to handle complex patterns, promising for future applications.
Final Thoughts: While Geneva Expert is the top performer here, other models like ARIMA and NBEATS are valuable alternatives depending on specific needs and priorities.
Best Practices for Effective Model Comparison and Data Transformation
Data Preparation
- Ensure Data Quality: Accurate forecasts start with clean, reliable data.
- Understand Data Characteristics: Check for stationarity, seasonality, and trends.
Model Selection
- Diversify Models: Testing models from different categories increases the chance of finding the best fit.
- Avoid Overfitting: Be wary of models that perform exceptionally well on historical data but may not generalize.
Evaluation Metrics
- Align with Objectives: Choose metrics that reflect your business goals.
- Use Multiple Metrics: A single metric may not provide the full picture.
Leveraging RoadMap TrailBlazer
- Maximize Features: Utilize all available tools for data transformation and model comparison.
- Iterative Testing: Continuously refine models and parameters for improved results.
- Documentation: Use the notes sections to track assumptions, considerations, and other factors for transparency and reproducibility.
Conclusion
Time series forecasting is a critical component of data-driven decision-making. Selecting the right model can significantly impact the accuracy and utility of your forecasts. RoadMap TrailBlazer offers a powerful platform to streamline this process by providing:
- A Wide Array of Models: Over 45 models across various categories.
- Automated Model Selection: Quickly identifies the best-performing model based on chosen metrics.
- Integrated Tools: Combines data transformation, visualization, and AI assistance.
- User-Friendly Interface: Accessible to users without extensive technical backgrounds.
In our case study, we demonstrated how Geneva Expert emerged as the top-performing model for forecasting pharmaceutical sales data. However, the best model may vary depending on the dataset and forecasting objectives.
By adhering to best practices in data preparation, model selection, and evaluation, you can leverage RoadMap TrailBlazer to enhance your forecasting capabilities and make more informed decisions.
Thank You for Reading!
We appreciate your time and interest in learning how RoadMap TrailBlazer can elevate your forecasting capabilities. If you need expert forecasting support, rapid forecast turnaround times, or customized solutions to tackle your unique business challenges, RoadMap Technologies is here to assist you.
Why Choose RoadMap Technologies?
- Expert Forecasting Support: Our team of seasoned professionals offers unparalleled expertise to enhance the accuracy and reliability of your forecasts.
- Fast Forecast Turnaround: We understand the importance of timely insights. Leverage our efficient processes to receive forecasts that keep your business agile and responsive.
- Customized Solutions: Every business is different. We tailor our services to meet your specific needs, ensuring optimal results and maximum impact on your bottom line.
Get Started Today!
- Visit Our Website: Explore our range of services at roadmap-tech.com and discover how we can help drive your business forward.
- Interested in TrailBlazer? Visit labofdata.com or the RoadMap TrailBlazer product page. Users can purchase and start forecasting within minutes!
- Contact Us: Have questions or ready to take the next step? Email us at lodi@labofdata.com — we’re eager to discuss how we can support your goals.
- Stay Informed: Subscribe to the Lab of Data Insights YouTube Channel for the latest software demos, tutorials, and industry insights.
Ready to Transform Your Forecasting Approach?
Join the ranks of businesses that have elevated their forecasting processes with RoadMap TrailBlazer. Get in touch with us today and embark on a journey towards smarter, data-driven success.
Enjoy Reading This Article?
Here are some more articles you might like to read next: